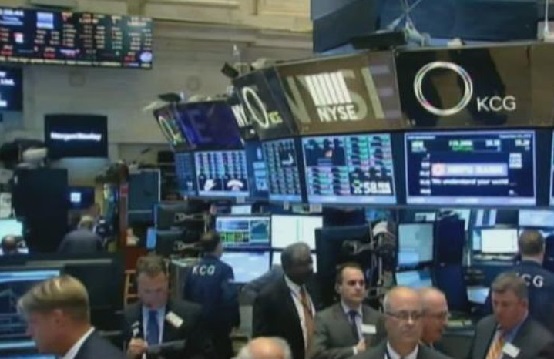
The Great Recession, which officially lasted from December 2007 to June 2009, began with the bursting of an 8 trillion dollar housing bubble. The resulting loss of wealth led to sharp cutbacks in consumer spending. This loss of consumption, combined with the financial market chaos triggered by the bursting of the bubble, also led to a collapse in business investment. As consumer spending and business investment dried up, massive job loss followed.
In 2008 and 2009, the U.S. labor market lost 8.4 million jobs, or 6.1% of all payroll employment. This was the most dramatic employment contraction (by far) of any recession since the Great Depression. By comparison, in the deep recession that began in 1981, job loss was 3.1%, or only about half as severe.
Even after the economy stopped contracting in the summer of 2009, its growth has not been nearly strong enough to create the jobs needed simply to keep pace with normal population growth, let alone put back to work the backlog of workers who lost their jobs during the collapse. In the post-World War II recessions before the early 1990s, it took an average of 10 months for the economy to regain the jobs it had lost during the recession. But after the early 1990s recession, it took nearly two years, and after the early 2000s recession, it took over three-and-a-half years.
Unfortunately, the recovery from the Great Recession is following the sluggish pattern of these last two recoveries, but likely with an even longer timeline. In October 2010, 16 months after the official end of the recession, the economy still had 5.4% fewer jobs than it did before the recession started. Thus, the Great Recession has brought the worst of both worlds: extraordinarily severe job loss, combined with an extremely sluggish recovery.
The job loss during the Great Recession has meant that family incomes have dropped, poverty has risen, and adults as well as children have lost health insurance. The bursting of the housing bubble and the drop in the stock market has meant that family wealth has dropped dramatically, as well. Rates of prostitution increased dramatically in many cities such as Las Vegas, as it became an income source of last resort for many women. This Review Journal article elaborates on this.

Job loss in the Great Recession was by far the most severe of any recession since WWII. In the two years from December 2007 to December 2009, the labor market shed 6.1% of all payroll employment. By comparison, in the deep recession that began in 1981, job loss, at 3.1%, was about half as severe.
While the peak unemployment rate was slightly higher in the 1981 recession than in the Great Recession, the increase in unemployment associated with the Great Recession was the largest increase in any recession in 70 years.
Racial and ethnic minority workers tend to have much higher unemployment rates than white non-Hispanic workers. For example, the black unemployment rate is generally around twice as high as the white unemployment rate, regardless of whether the economy is in an expansion or a recession. This means that during recessions, black workers experience much larger increases in unemployment.
It is impossible to capture the strength or weakness of something as complicated as the U.S. labor market with one number. Therefore, it is important to look not just at the unemployment rate, but also at a host of measures of labor market health. Around 27 million workers — roughly one out of every six U.S. workers — are either unemployed or underemployed. Importantly, this is a very conservative measure of the total number of underemployed because it does not include workers who have had to take a job that is below their skill or experience level.

The Great Recession has broken all records related to duration of unemployment. The chart below shows the share of the unemployed who have been jobless for more than six months. This share has been over 40% for all of 2010, far above its prior peak of 26% in the summer of 1983. Once workers gets laid off from a job in this labor market, the odds are stacked strongly against them finding another one anytime soon.
Job seekers outnumber job openings by a significant margin—in September 2010, the ratio was 5 to 1. Importantly, this isn’t the number of applicants per job opening—that number is much higher, as one unemployed worker applies for many jobs. The 5-to-1 ratio means that for four out of every five unemployed workers, there literally are no jobs.
That is actually a substantial improvement over late 2009, but it is still far higher than the worst month of the previous recession and over three times as high as in 2007, before the Great Recession started. See this article for more.
The last two recessions have been characterized by very slow labor market recoveries. If job growth is similar to that of the last two recoveries (early 1990s and early 2000s), then the much greater scale of job loss in the Great Recession means it could be well into the next decade before we make up all the jobs lost.

This work is licensed under a Creative Commons Attribution-ShareAlike 3.0 Unported License.
